At a glance
Each team needed a different view of the same data, and fixed screens couldn't give it to them.
Lead UX/UI designer: widget model, library, setup flow, sharing and states.
Teams assemble, preview and share their own live dashboards without leaving Genie.
10
Widget types in the library
∞
Instances of any widget, each with its own configuration
3
Permission roles: Admin, Can edit, Can view
One platform, many questions
An analyst wants share of voice, a manager wants engagement coverage, a leader wants one page for the board. Fixed screens forced them to rebuild the same view every week, often in slides.
Before
- Same filters re-applied across several pages
- Screenshots pasted into weekly slides
- No shared view a whole team could open
With dashboards
- Saved widgets keep their own targets and filters
- A live page that's always up to date
- Shared with people or groups by role
A dashboard is a set of saved questions
I modelled each widget as a saved question: what to watch, compared to what, filtered how, over which period. The dashboard just arranges and shares them.
The widget model: every chart remembers the question behind it
Three decisions that shaped the product
Reusable widgets, not fixed charts
Add the same widget many times with different settings, such as one share-of-voice widget per market.
Preview before you commit
Setup shows the real chart beside the form, so nobody adds a widget that turns out empty.
Ask for intent, not just settings
A short description on every dashboard and widget helps teammates, and gives Ask Genie and spike analysis context.
Honest loading and empty states
Loading explains how to get faster results; empty widgets link straight to their settings.
User flows
Build a dashboard
Goal: a live view for one recurring question
-
Create the dashboard
Name, purpose and who can access it
-
Pick a widget
10 types, from share of voice to custom HTML
-
Configure with live preview
Targets, filters and period, with the real chart beside the form
-
Arrange
Resize widgets and lay out the grid
Result: a reusable view that answers the same question every day, with no slides needed.
Share it with the team
Goal: everyone looks at the same numbers
-
Set general access
Private, or the whole workspace
-
Add people or groups
With Admin, Can edit or Can view roles
-
Pin for quick access
Pinned dashboards sit as tabs; the rest are one search away
-
Browse all
Owner, dates and widget count in one list
Result: one source of truth for a team, with control over who can change it.
Morning check-in
Goal: spot what changed in five minutes
-
Open a pinned tab
A personal greeting, then the widgets
-
Scan the trends
Percentage change and spikes on every widget
-
Find the gaps
The engagement heatmap shows who and where is under-covered
-
AI
Ask why
Widget descriptions give Ask Genie the context to explain a spike
Result: a daily habit inside Genie instead of a weekly reporting task.
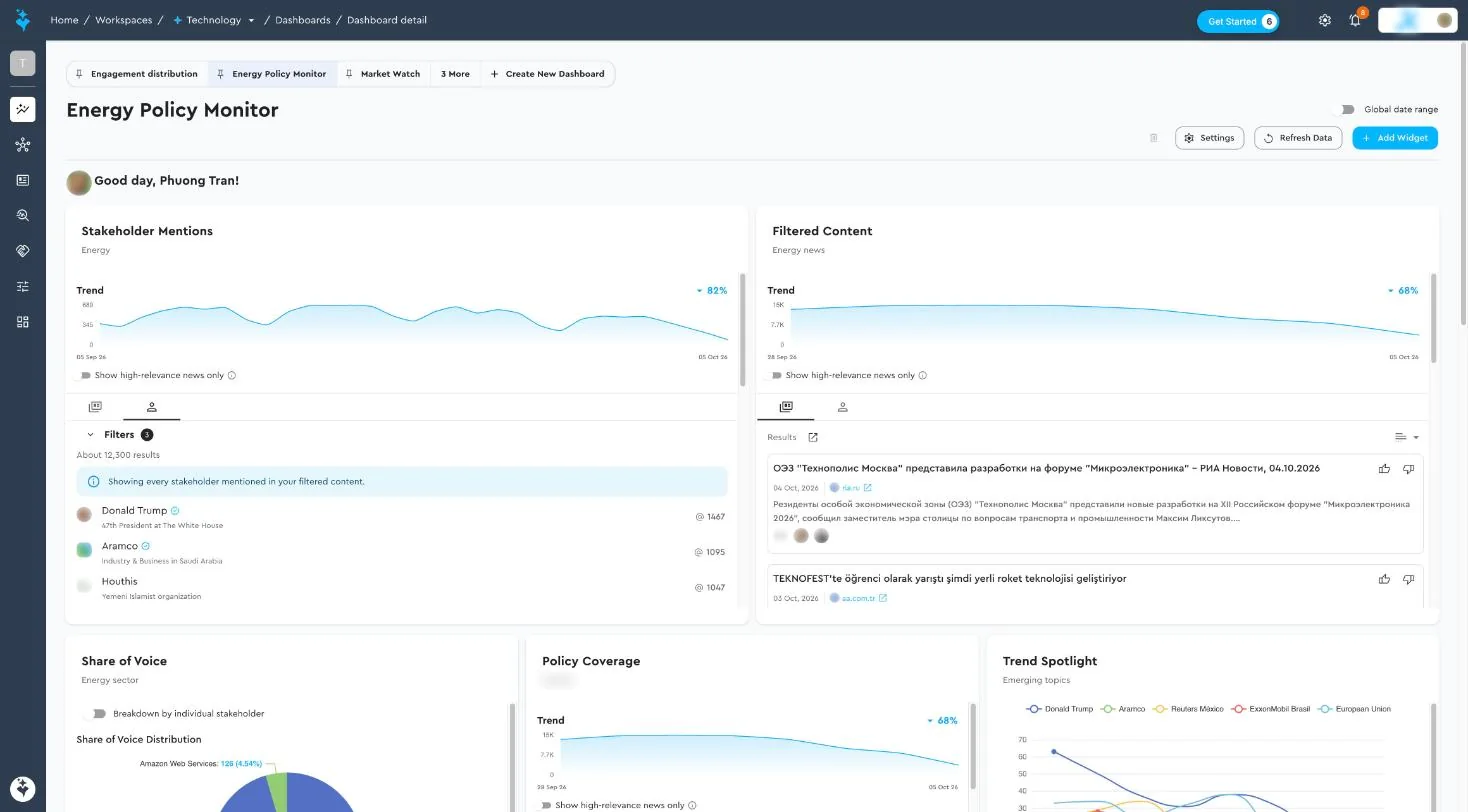
Screens
Screens from the live product. People, contact details and internal names are anonymised.
From fixed pages to a view each team owns
- Shipped: widget library, live-preview setup, pinned tabs, search, sharing roles and a global date range.
- Built on the platform: widgets reuse Genie's targets, saved filters and Ask Genie, so there's nothing new to learn.
- Room to grow: custom HTML and text widgets let teams embed their own trackers and notes.